 The third way you can participate in this course outside of class is to contribute entries to the collaborative cryptography timeline we’ll build as a class. Here’s an introduction:
What Is a Collaborative Timeline?
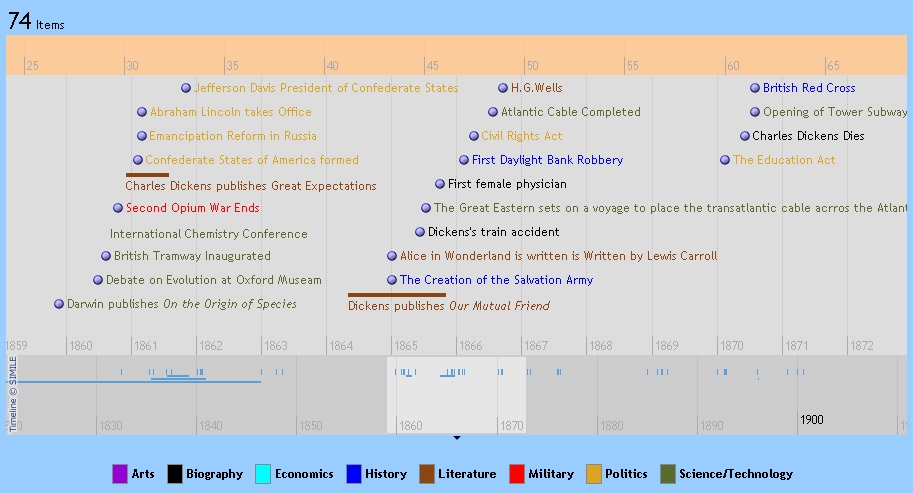
You’re probably familiar with timelines, which are visual representations of events that happened in the past where the horizontal axis represents time. A collaborative timeline is just a timeline constructed by a group of people working together, kind of like a wiki is a website written by people working together. Here’s an example from a course on the Victorian Age at Central Connecticut State University.
You can see our collaborative cryptography timeline here. As I write there, there’s not much there, just four events from the history of cryptography. Over the semester, you’ll have the chance to add more events to the timeline and, in the process, contributing to your participation grade.
How Do I Read the Timeline?
If you hover your mouse over the timeline, it will turn into a hand that you can use to “grab” and move the timeline to see different parts of it. The light gray band is marked off in 10-year intervals; the dark gray band is marked off in 100-year intervals. If you grab the dark gray band and move it around, you’ll scroll through the timeline faster.
If you click on one of the entries in the timeline, you’ll get a pop-up box with more info–a description, maybe an image, maybe a link to a website. While the timeline helps you see how events relate to each other in time, it’s the pop-up boxes that have the details on particular events.
You’ll notice that each event is categorized and color-coded. On the right side of the screen, you’ll see a list of those categories. Click on a category to filter the timeline so that only events in that category appear. Once you’ve done so, you can uncheck the box next to the category to remove the filter and see all the events again.
There’s also a search box on the right side of the screen. Enter a search term and you’ll see only those events that include that search term–either in the event name or in the pop-up box.
Why a Collaborative Timeline?
Although I haven’t searched exhaustively, I haven’t found a good timeline showing the history of cryptography, so I thought we would make one together. As you go through the course, the timeline will be helpful to see how various events in the history of cryptography relate to each other over time. And when you go to write your final essay in the course, the “Big Questions” paper, you’ll probably make good use of the timeline as you pull together evidence for your arguments.
Although I could probably put together a timeline on the history of cryptography for you, I would much rather involve you in the process of building it. This way, when the semester is over, the class as a whole will be able to point to this timeline (freely available online for others to use) and say that we built it.
Contributing to the Timeline
The data that appears in the timeline is pulled from this Google Spreadsheet.To contribute to the timeline, you’ll first have to get access to edit this spreadsheet.
Head for the spreadsheet itself and click on “Edit this page” at the bottom left. You’ll be prompted to sign in using a Google account. (I think your Vanderbilt email will do, since it’s powered by Gmail, but let me know if it doesn’t.) After that, you should get a notice that you don’t have permission to edit the spreadsheet. There should be a link that reads “request access to this document.” Click on that and wait for me to give you access.
Once you have access, visit the spreadsheet and click “Edit this page” at the bottom to add something to the spreadsheet. Follow these instructions:
- Always add your entries at the bottom of the spreadsheet, in the first empty row.
- The first field, {label}, is the text that will appear on the timeline. Please keep this text relatively short. To add italics, type something like “Simon Singh’s <em>The Code Book</em>” (but without the quotes). The “<em>” and “</em>” need to bracket whatever you would like to appear in quotes.
- The second field, {start:date}, is the date of the event. You must enter the date in yyyy-mm-dd format. If all you have is a year, then just enter the year, leaving off the month and date.
- The third field, {end:date}, is optional and can be used to indicate the end of an event that spans a length of time. Again, use the yyyy-mm-dd format.
- The fourth field, {description:single}, is the text that will appear when you click on the event in the timeline. You can link to another Web site here if you like. The format is as follows: <a href=”http://www.google.com”>Google</a>. Also, be sure to cite your source somehow.
- The fifth field, {image:url}, is optional and can be used to display an image in the box that pops up when you click on an event. If you find an image you like online, you can usually right-click the image, select Properties, then find the address of the image under Address, Location, or URL. Copy this Web address and paste it in the Google spreadsheet.
- The sixth field, {cat}, assigns the event to a category. You can make up your own category if none of the ones already in use fit. Don’t get too carried away, however, since too many categories isn’t helpful.
- The seventh field, {initials}, is where you should list your initials. Contributing to the timeline is one way to affect your class participation grade, so I want to make sure to give you credit.
That should do it. I know that this isn’t quite as straight forward as leaving a comment on the blog or tagging a website in Delicious, but I think that once you do it once or twice, you’ll find it’s pretty straight forward. But, please, let me know if you have questions.
Leave a Reply